Traqmate, by Track Systems LLC is one of the leaders in data acquisition. Used by SCCA Pro Racing & NASA to analyze car performance to ensure rules equity, the Traqmate system has the features for full-on pro racing, but remains simple enough for beginning drivers.
What is Traqmate?
The Traqmate is a vehicle data acquisition device that uses a high-speed GPS receiver and high resolution accelerometers to track and record the speed of a vehicle, its absolute location, and forces acting on the vehicle.
At the heart of the system is our award winning software. Traqview analysis program uses advanced mathematical algorithms to translate this data into visual form where it is easy to spot differences between drivers, vehicles, and sessions. It's extremely easy to use and very powerful.
With the Traqmate Complete you get a Predictive Lap Timer and unique modes such as Drag Racing, Autocross, Braking, G-force, and GPS Compass to have fun, tune your car, or even find your way to the track! Add inputs using TraqData to display warnings and other information.
The Traqmate Display Unit doubles as a USB storage device so you can Replay Your Day quickly and easily.
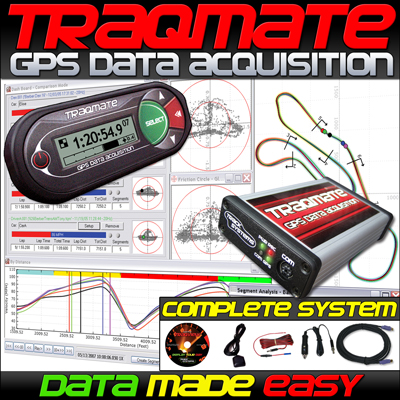
Traqmate Complete
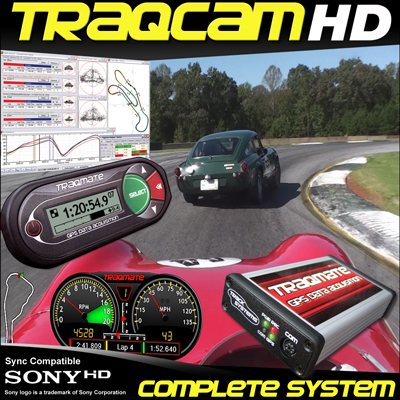
TraqCam Complete HD
TraqCam Complete HD Bundle is the simplest and most cost-effective HD video and data system you can buy.
By collecting synchronized data and HD video you get the best of everything. Play back the data with synchronized HD video with TraqStudio, our award-winning analysis software with a built-in video and audio player. See exactly what you are doing on track to help you improve as a driver. When you combine the visual reference of video and real hard data you can quickly create your ideal driving technique. It's like having a professional training coach, you will get faster.
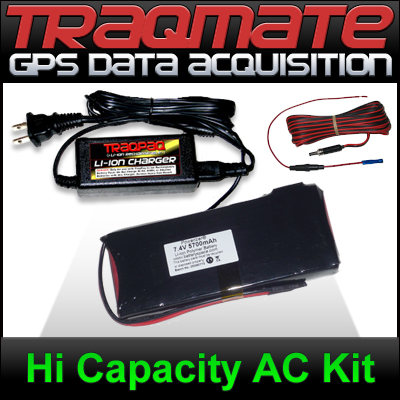
Batteries
For vintage racers or folks in cars without access to the electrical system, Traqmate provides the Traqpaq, various forms.
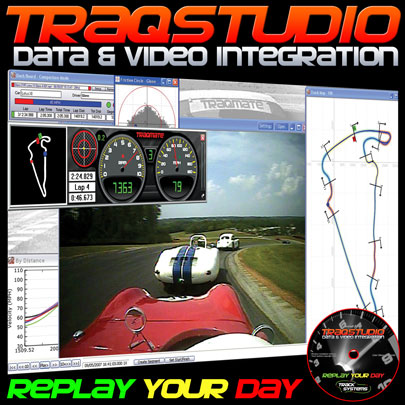
Traqview & Traqstudio
A data acquisition system is only as good as the analysis program. Traqview is a new approach that merges hard-core data analysis with the fun of a video game. The track mapping is accurate and gives an instant read on what is happening where. Multi-car playback lets you see graphically who is faster where.
Record several cars in a race and replay the entire race in real-time, slow-mo, or fast forward. See their speed, G loads, braking and acceleration for every car on the virtual dashboard.
Traqview has all the tools you need to optimize the performance of both car and driver. For example, you can display graphs like Velocity vs. Distance to see who is faster in which corners and then define a sector on the map and zoom in to see braking points, instantaneous velocities, acceleration points, and transfer speeds through a corner.
Traqview is your single point of contact for everything in the Traqmate System. Use it to upload data from Traqmate, analyze the data, configure Tracks, Drivers, Vehicles and optional Sensors, change the Sampling Rate, and even download future software and feature upgrades into your Traqmate.
TraqStudio Data/Video Integration Software allows you to easily synchronize your SD/HD video and data and create SD & Converted MP4 videos with data overlay for the ultimate track experience. When you collect data and video together with Traqmate you'll be blown away at how much quicker you will become. TraqStudio is powerful, easy to use, and completely integrated.
What makes TraqStudio Different?
TraqStudio is our powerful data analysis software that integrates video seamlessly. You are getting an analysis AND video creation package, not simply video with gauges. This allows you to go in depth into each session, see your line, the other cars and every minute detail while having the hard data synced up right there next to it for the ultimate training tool. The SD & MP4 video creation the second element of the package that allows you to personalize your videos for yourself, the web or your company.
Track Map
The Track Map is the heart of the GPS Data Acquisition System.
G vs. Time
The G vs. Time Graphs (Lateral and Accel/Braking) are just like the G vs. Distance Graphs (see below) only they are plotted over time instead of distance. Therefore, it is most useful for analyzing a single vehicle since two different laps will not match up on the time scale. If you select several laps they will be shown end-to-end so you can see a progression of the G levels obtained during a session.
G vs. Distance
The G vs. Distance Graphs (Lateral and Accel/Braking) show the G forces that are occurring at each place around the track. By playing back a lap and following the vehicle icon on the Track Map and the vehicle cursor on the G vs. Distance Graphs, you can see exactly what happened such as a touch of the brakes or a steering correction in the corner. This is a very useful graph for comparing two driving styles.
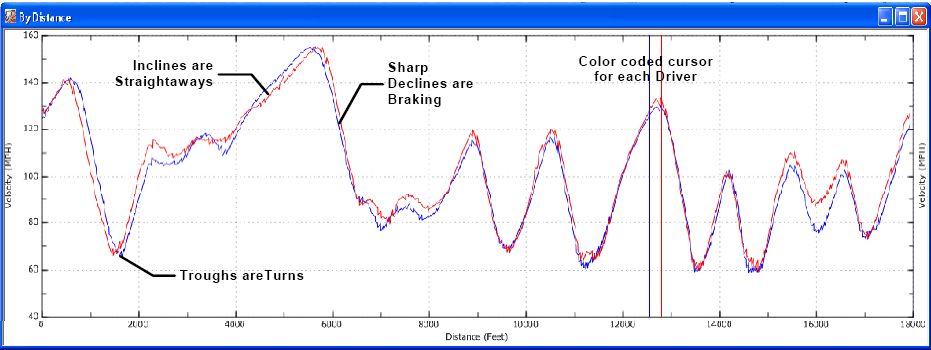
Velocity vs. Distance
This is the most useful graph for comparing two or more drivers or cars. You can get an instant read on where a driver is carrying more speed through a turn, which car has the best top speed at the end of a long straightaway, and which car accelerates the best. It is easy to determine which trough is which turn by playing back the vehicle position on the Track Map and watching the cursor positions on the Velocity vs. Distance Graph.
Friction Circle
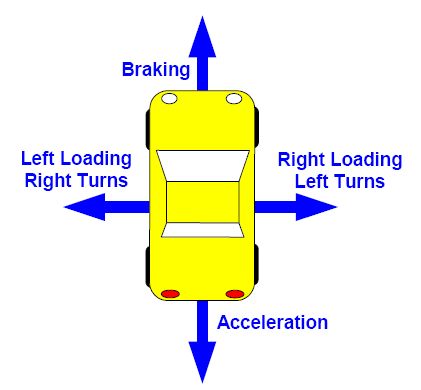
The Friction Circle graph shows the forces acting on the vehicle in the forward, reverse, left, and right sides, plotted on an X,Y Graph where the vertical axis is Braking/Acceleration and the horizontal axis is Left/Right Loading. For most vehicles, the shape of the Friction Circle graph will be an inverted triangle. The reason for this is that most vehicles stop much better than they accelerate so more forces will be generated in that direction.
This graph is used to gauge the overall amount of performance available in the car and the amount of that capability the driver is using. Especially of interest are the transitions from braking to turning to acceleration. By watching the cursor move around the graph during playback, you can see the transitions. It is useful to picture the car from overhead as in the diagram and think of the cursor as the top of the driver’s helmet.
Note that the Friction Circle shows peak loads. A tire near maximum grip level is constantly gripping and releasing the pavement. In addition, a hard turn-in will generate instantaneous loads that are not sustainable. The extremely sensitive accelerometers will pick this up, creating peaks in the data. While these are real, the actual sustained level of grip that can be measured on a skidpad is somewhat lower.
Braking and Acceleration Zones
The Brake Zone Map shows the forward/reverse forces acting on the vehicle and where they occur on the track. This graph will show what a driver is actually doing on the track. As you can see from the illustration below, this includes where the driver is flat or where they are lifting, techniques such as lifting to orient the vehicle, how fast the driver’s transitions are from brake to acceleration and back. Many times you can even see shift points!
Enable the Brake Zones with the enable control on the Brake and Turn Zone map. Use the Braking and Acceleration threshold adjustments to tune the map to your particular car and reveal hidden information.
Turn Zones
The Turn Zone Map shows the lateral forces acting on the vehicle and where they occur on the track. This graph is primarily used to show turn in and turn out points. When combined with the brake zone map you can see trail braking and where the acceleration is applied during the turn.
Enable the Turn Zones with the enable control on the Brake and Turn Zone map. Use the Turn Zone threshold adjustments to tune the map to your particular car and reveal hidden information.
Right turns are shown as dark blue and left turns are shown as yellow. Black is shown where the vehicle is traveling mostly straight.
You can use these transition points to set up segments on a reference lap, save as a .tqs file, and then add laps to it later to see if speed has been gained or lost in a particular set of turns.
When you enable Turn Zones and Brake Zones at the same time, you get a combination of colors. While the “rainbow map” may seem confusing at first there is a lot of useful information contained in those colors.
For example, braking is Red and right turns are Blue. If you see a Purple segment that shows that the driver was braking and turning right at the same time (i.e., trail braking).
Similarly, Orange indicates trail braking into a left turn. Chartreuse and Turquoise show turning while accelerating, which can reveal where the throttle is applied during a turn.
Experiment with the thresholds to reveal even more information.
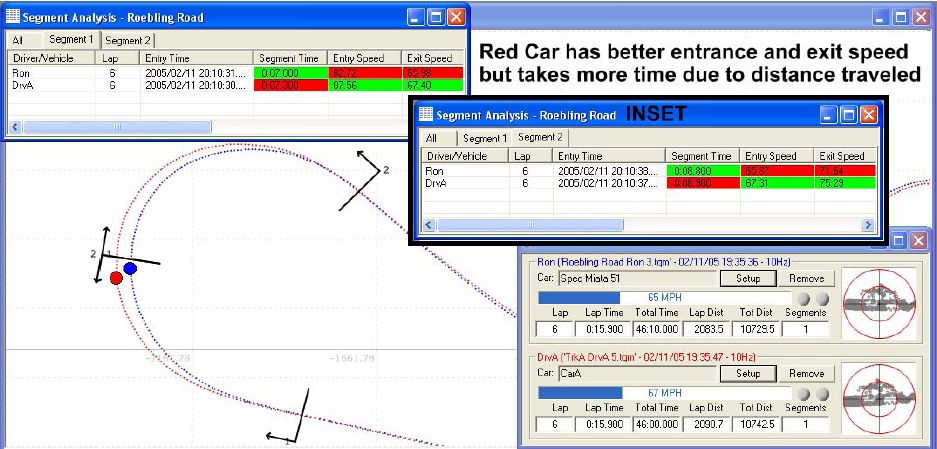
Segment Analysis
One of the most powerful features of Traqview is Segment Analysis. This allows you to compare two small sections of the track on several laps. This is especially useful for comparing two drivers who might take different approaches to a corner or for doing a before/after comparison of a new technique or driving line.
Using Traqmate for Analysis
This section will serve as a tutorial for using the Traqmate Data Acquisition System for analysis of drivers and vehicles. There are many ways to use the data and these are only a few methods. It is always best to experiment to find the specific areas of interest for your situation.
Driver Comparison
When comparing drivers, it is best to record laps in the same vehicle or at least very similar vehicles. Otherwise, the performance capabilities of the vehicle can mask the differences in the drivers. In addition, driving styles differ between types of cars. A good driver will have different braking, turn in, and acceleration points in a front-wheel-drive car than in a rear-wheel-drive car.
Best Lap Playback
The easiest way to compare drivers is to pick their best single laps, load them up on the track map and play them back. Watch the entire lap and note where one driver pulls away significantly from the other. Then concentrate on those areas using the other Traqview tools.
Best vs. Worst Playback
Sometimes you can see differences most readily by taking the best and worst laps of a session for a single driver. This can make mistakes more apparent.
Velocity vs. Distance
Driver differences are most apparent when viewing the Velocity vs. Distance graph. To get an accurate picture you may need to look at several laps because you never know what happened on a single lap. A driver might have lifted to avoid another car or may have had the advantage of a draft from another car on a straightaway.
After looking for areas of improvement on the Velocity vs. Distance Graph, you need to determine just how to make those improvements. The best way is to create a segment surrounding the corner on the track to be improved.
Driving Line
Generally, it is best to be “Slow In, Fast Out”, especially if there is a long straight after the turn in question. That faster exit speed will compound over the entire distance of the straight. Segments are the perfect way to test entrance speed vs. exit speed. If you are entering a long complex of curves, it may be smart to be Fast In, Slow Out. The best way to determine this is to create two segments on consecutive sections of the track. This way you can see if sacrificing entrance speed on one section leads to commensurate gains on the next section.
Segments
Sometimes entrance and exit speed can be deceiving. Segment Analysis can also show you the real story. In this diagram, taking the long way around results in higher speeds but longer times.
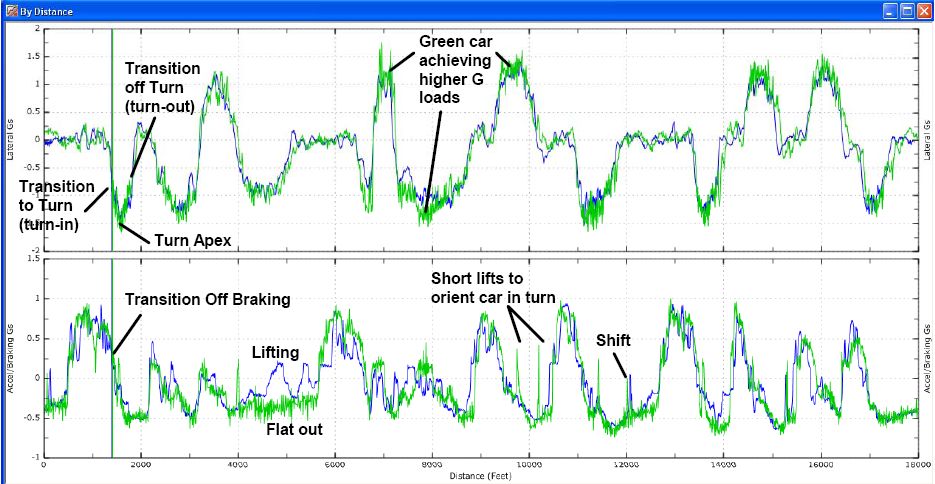
G vs. Distance Analysis
The G vs. Distance graphs show the G forces on the vehicle plotted against the distance traveled. This is very useful for viewing the overall performance envelope that a driver is using in the car. On the graph below you can see that the green car’s graph lines are consistently outside the blue car’s, indicating that the green car is carrying more speed through the turns and consequently generating more lateral cornering force.
Another useful element of this graph is the ability to determine when a driver hits the brakes and throttle. You can clearly compare when each driver hits the brakes, gets off the brakes, and gets back on the gas.
This graph is also good for comparing braking curves for the drivers. Optimally you want to see a good crisp initial brake pressure, even pressure during braking, and then a clean transition off the brakes and into the turn. If you position the cursor at the end of the brake application (as shown), it should also intersect the turn in point.
Also look for nice smooth lines. Spikes in the acceleration line indicates a throttle lift or brake tap, which is usually not desirable.
Friction Circle
Often you can get a quick idea of driver’s skill by simply looking at their Friction Circle plot. A beginning driver will generally have a plot that appears like an inverted T with dips on the sides. This is because they brake straight, get off the brakes, then turn.
As a driver gains experience, his Friction Circle will be much more triangular and follow the perimeter of a triangle. This happens because the driver is transitioning from braking to turn-in in a coordinated fashion. A very experienced driver’s Friction Circle will have a visible hole in the center showing that the maximum grip of the car is being used at all times. When playing back in real-time you can see the cursor go around the outside of the triangle.
To determine how much of the performance of the car is being utilized, do a skidpad test as described in the vehicle performance section below.
Graphing Multiple Data Elements (Stacked Graphs)
With Traqview, all the items on the graph are synchronized as you play back one or more laps. Use the Setup button on the dashboard to add elements to the common scale distance or time graphs and then play it back to see the relationship between the various elements being monitored.
As you configure Analog and Digital points in Traqview, they are added to the available items in Setup by name. In this graph, Oil Pressure and RPM have been collected using the TraqData input device.
In this analysis you can see the brakes applied before the turns, you can see the RPM peak at the redline, shift points in both the track map and Accel/Braking graphs, and the RPM drop after a shift. You can even see the oil pressure drop when the engine is unloaded during a shift.
Vehicle Performance Comparison
Traqmate can measure many performance capabilities of the vehicle, including acceleration, braking, and lateral grip.
Acceleration and Braking
A good way to evaluate horsepower is to draw segment on a straight part of the track between shift points and in the brake zones. Then look at the Max Acceleration and Max Braking values in that segment. You can also see the difference in power between vehicles visually by looking at the slope of the lines in the Velocity vs Distance Graph since the rate of gain of velocity is acceleration. Similarly, by looking at the negative slope one can determine the strength of the brakes (and of course the adhesion of the tires).
Lateral Gs
To evaluate the outer limits of chassis adhesion, the proven method is the skidpad. Traqmate is an ideal tool for collecting and analyzing skidpad data.
Share & Compare – Trading Laps Online at Traqmate
This innovative feature allows you to upload and download laps from around the world. You can quickly learn what you are doing right (or wrong) by comparing yourself to other skilled drivers. Great way to gauge your driving skills as well as compare your car against others. Create the virtual race you have always dreamed of with Traqmate.
Pros Use Traqmate
"If you want to improve both car and driver, Traqmate is the best purchase you can make" -Guy Cosmo
"I truly believe your product can be a great help to drivers looking to improve their performance" -Randy Pobst
"For regular Joes, the Traqmate gives you all the basic information -and even more- for less than a set of tires, and is worth every penny" -Randy Pobst